EMCCDs are devices capable of sub-electron read-out noise at high pixel rate, together with a high quantum efficiency (QE). However, they are plagued by an excess noise factor (ENF) which has the same effect on photometric measurement as if the QE would be halved. In order to get rid of the ENF, the photon counting (PC) operation is mandatory, with the drawback of counting only one photon per pixel per frame. The high frame rate capability of the EMCCDs comes to the rescue, at the price of increased clock induced charges (CIC), which dominates the noise budget of the EMCCD. The CIC can be greatly reduced with an appropriate clocking, which renders the PC operation of the EMCCD very efficient for faint flux photometry or spectroscopy, adaptive optics, ultrafast imaging and Lucky Imaging. This clocking is achievable with a new EMCCD controller: CCCP, the CCD Controller for Counting Photons. This new controller, which is now commercialized by Nüvü Camēras inc., was integrated into an EMCCD camera and tested at the observatoire du mont-Megantic. The results are presented in this paper.
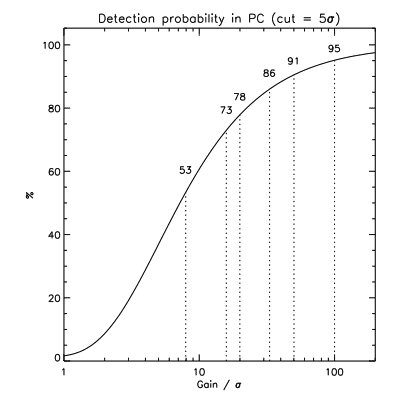
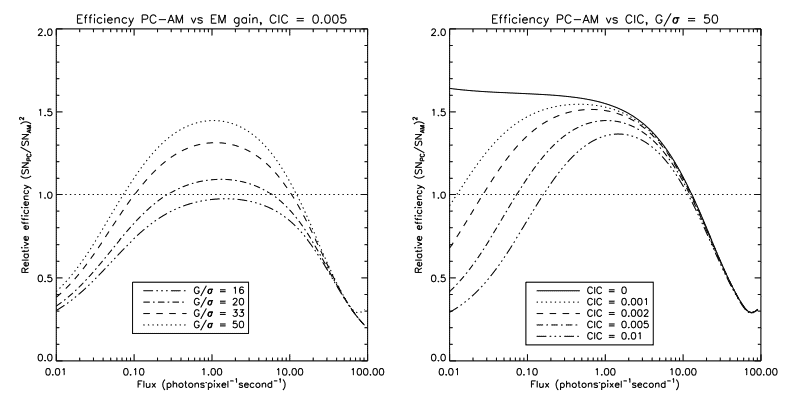
The operation of an EMCCD1 in Photon Counting (PC) mode enables one to get rid of its Excess Noise Factor (ENF).2, 3 The ENF usually plagues the EMCCD when it is operated at a high EM gain and when it is attempted to count more than one photon per pixel per image.2–4 This operating mode is referred to as the Analogic Mode (AM). The PC operation, on the other hand, implies counting only one photon per pixel per image. The reduced dynamic range of an image must be compensated by reading the EMCCD at a faster pace to avoid the losses by coincidence that occur at high flux. However, in order to be efficient, the PC operation requires the operation of the EMCCD at a very high EM gain. An EM gain that is too low will result in many photons being lost in the read-out noise. Figure 1 summarizes this effect. The operation of the EMCCD at a high EM gain will usually yield a higher Clock Induced Charges (CIC) level.5 In PC operation, the CIC, which might be negligible as compared to the dark noise for long integration times (> 30 sec), quickly arise and become the dominant source of noise.6–9 Thus, in order to avoid the ENF of an EMCCD, one must tame the CIC down to very low levels while having a high EM gain. Even if the CIC could be lowered by operating the EMCCD in Non-Inverted Mode (NIMO), the Inverted Mode operation (IMO) of the EMCCD is preferable to keep the dark current low. Figure 2 shows that at a moderate CIC level (0.005 ¯e/pixel/image), the PC operation at a G/ ratio of 20 (which is typical of a of 50 ¯e and an EM gain of 1000) will barely be more efficient than the AM operation, and for a very limited flux range. Realistically, it is useless to operate such a camera in PC mode, as there are more disadvantages (losses by coincidence, higher noise at low fluxes) than advantages (less than 10% decrease in integration time for a very limited flux range). A higher EM gain is required to render the PC operation useful. On the other hand, even with a G/σ of 50, a very low CIC level is required for the PC operation to be more efficient than the AM operation over a wide range of fluxes.
In order to reduce the amount of CIC generated by the read-out process of an EMCCD, while being able to produce a very high EM gain, a whole new EMCCD controller was built. CCCP, the CCD Controller for Counting Photons, was designed specifically to address these issues. In this paper, the controller will be presented in section 2, and experimental results obtained with a camera built with CCCP and a CCD97 (hereafter CCCP/CCD97) will be shown in section 3.
The CCCP controller is a complete EMCCD controller. It generates the clocks and biases, allows the digitization of the CCD output signal and includes a communication interface to transfer pixel’s data to an acquisition computer. The controller components and capabilities are outlined in the subsequent sections.
2.1 Electronics
The CCCP controller comprises three components:
• One power supply ;
• One digital sequencer and communication board ;
• One clock, bias and video board.
The power supply generates the various voltages for the controller’s operation. It is a switching power supply whose switching clock can be made synchronous with the pixel acquisition. The power supply clock can be synchronized at the beginning of every read-out process. This allows a fixed noise pattern (very dim, though) to appear in the bias of the CCD, which can be subtracted easily with bias frames.
The sequencer board generates the synchronization signals needed for the operation of the clocks and video digitization. It has a time step of 10 ns. The sequencer also allows the operation of a shutter in sync with the read-out, it has a fire output to synchronize an external device with the exposing of the CCD, and it allows an external input to trigger the integration and read-out process. The sequencer board also has a Camera Link communication interface to transfer the pixel’s data to an acquisition computer. The Camera Link has an imbedded serial (RS-232) interface to allow the acquisition computer to send commands to the controller.
The clock, bias and video board is the board that interfaces with the EMCCD. Up to 4 of these boards can be stacked into a single controller. Every board generates 13 conventional clocks and 1 High Voltage (HV) clock for the operation of the EM stage of the EMCCD. The 13 conventional clocks are updated every 10 ns and have a voltage resolution of 12 bits. This means that every 10 ns, the output of every clock can be independently switched to any of the 212 producible values. The clock output is 350 mA between ±15 volts. Other voltage configurations are possible.
The HV clock is generated by making an inductance resonate with the capacitance of the EM stage of the EMCCD. The switching of the resonant circuit can be adjusted in steps of 1 ns, and the HV clock high and low levels can be adjusted independently by 14 bits DACs. The controller allows the HV clock amplitude to be changed in sync with the read-out process, which enables one to change the EM gain throughout an image. Various biases are generated by this board. Theses are constant voltages that can each be adjusted by a 14 bits DAC. Finally, this board has provision for 16 bits data acquisition (up to 12.5 MHz) for a selection of two CCD outputs (usually the conventional and EM outputs) and a high speed (up to 30 MHz) 14 bits data acquisition for one output (usually the EM output). The bandwidth of both 16 bits inputs can be adjusted (through resistors and capacitors selection) to optimize the noise figure of the video acquisition. A new video board, optimized for low speed (50 kHz – 1 MHz), very low noise acquisition is under development.
2.2 Clock generation
The biggest improvements this controller carries over other controllers are related to the clock generation. The high time and voltage resolutions of the arbitrary clock generators allow one to produce any clock shape. The vertical as well as the horizontal clocks can benefit of this feature.
By using these arbitrary clock generators, it was possible to measure the impact of the clock shape on the CIC generated during the read-out process. Results are presented in section 3.1.
Measurements were made in laboratory to characterize the CIC generated by the read-out process of a CCD97 driven by CCCP. The results are presented in this section. Scientific data gathered at the Observatoire du mont-Megantic 1.6 m telescope are also presented.
3.1 Laboratory experiments
The camera built with CCCP and a CCD97 was characterized in laboratory. Emphasis was put on the measurement of the various sources of noise generated by the EMCCD. The results are presented in this section. Other characterization parameters of the camera were also measured (EM gain stability over frame and over time, SNR as a function of the flux and the operating mode, etc.). The results were published in [5].
3.1.1 CIC
The motivation behind the building of the CCCP controller was to test the impact of the clocks shape on the amount of CIC generated during the read-out. Since any clock shape can be generated with this new controller (section 2.2), it was easy to produce the plot presented in figure 3.
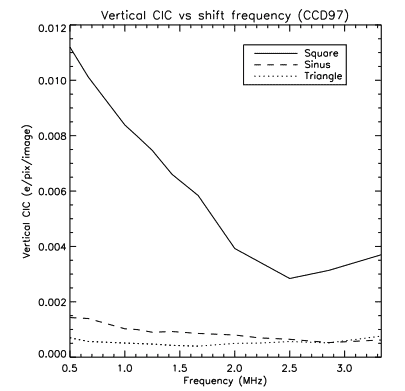
This figure shows that at low frequency, the triangular waveform produces less CIC than its sinusoidal and square counterparts. However, the sinusoidal waveform can move charges at a faster pace than the triangular clock while keeping the CIC low. On the CCD97, the minimum mean level of vertical CIC measured for the triangular clock is 0.0004 ¯e/pixel/frame at 1.67 MHz. The minimum mean level of vertical CIC measured for the sinusoidal clock is 0.0005 ¯e/pixel/frame at 2.85 MHz.
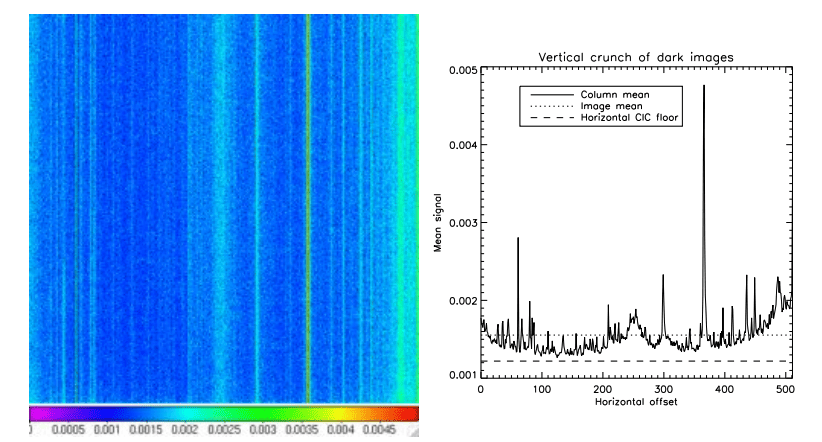
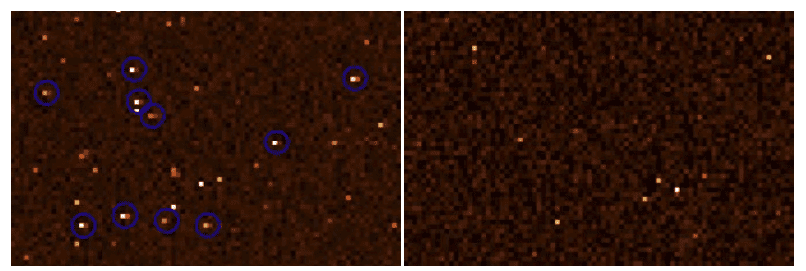
Figure 4 shows the analysis of about 100000 dark images of 0.05 seconds of integration acquired with sinusoidal vertical clocks. The vertical structure visible in the image is caused by the vertical CIC, which is not homogeneous across the frame. The amount of CIC generated into the horizontal register is plotted in the right panel of this figure. It shows that some regions of the EMCCD are nearly free of vertical CIC. This suggests it is theoretically possible to produce EMCCDs that, with the help of CCCP, would be nearly free of vertical CIC. This would imply an enhancement of the manufacturing process to avoid traps from being created at the surface of the CCD, a tedious task.
3.1.2 CTE
The charge transfer efficiency problems were noticed in the EM stage of EMCCDs.10, 11 The enhanced time and voltage resolution achievable with CCCP allow one to better control the CTE across the whole device. In the horizontal register, measurements showed that the CIC level is very dependent on the CTE (low CTE yields low CIC, high CTE yields high CIC). Thus, in order to achieve low CIC and high CTE, the clock waveforms must be very precisely controlled. Figure 5 compares the CTE achieved with CCCP and a commercial EMCCD camera.
3.1.3 Efficiency comparison
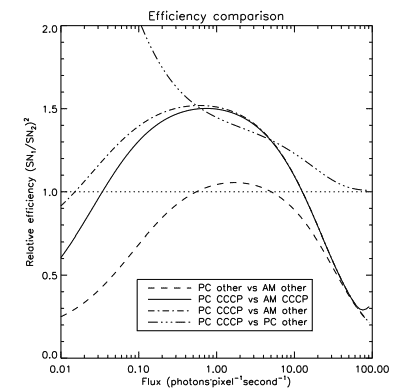
With the high (> 3000) EM gain producible with the controller and the low CIC level, it is possible to compare the efficiency of the CCCP/CCD97 camera and the commercially available EMCCD cameras based on the CCD97. Most of the commercial cameras advertise an EM gain of 1000, a read-out noise of ~50 ¯e at 10 MHz, and a CIC level of 0.005 ¯e/pixel/image. Figure 6 compares the efficiency of such a camera with the CCCP/CCD97 camera. The higher CTE achieved with CCCP/CCD97 is not taken into account in these plots. The figure shows that the PC operation of the CCCP/CCD97 camera allows a given SNR to be achieved up to 33% faster over the 0.1 – 10 photon/pixel/second range at 10 frames per second than with the AM operation at 1 frame per second (plain line). For lower flux operation, a lower frame rate can be used to move the efficiency curve towards the left side of the plot. The CCCP/CCD97 camera is dominated by the dark noise for integration times longer than 5 s regardless of the operating mode. It is thus useless to expose the camera for more than 5 s. The dash-dotted line compares the PC operation of CCCP/CCD97 with the AM operation of the commercial camera. The dash-three-dots line compares the PC operation of both cameras.
The CCCP/CCD97 camera was installed on the 1.6-m telescope of the Observatoire du mont-Megantic (OMM). The ´ camera was placed at the focal plane of the f/2 focal reducer of the telescope, giving a plate scale of 1.0700 per pixel. The focal reducer has an intermediate pupil into which a Fabry-Perot (FP) interferometer was placed. This Integral Field Spectrometer, known as FaNTOmM,12, 13 is usually fitted with an Image Photon Counting System (IPCS) made of an AsGa photocathode. The biggest advantage of the photocathode is its very low noise (~10-5 e/pix/sec), but its overall efficiency is limited by its low QE, which is 28% at maximum.
The FP interferometer is a scanning instrument. It is of great interest to scan it multiple times during an observation in order to average the changing photometric conditions of the sky. The high (R>10000) spectral resolution makes these observations read-out noise limited when using conventional CCDs. This is the reason the FP interferometer is best used with a photon counting imager. Single exposures can be made arbitrarily small as there is no read-out noise. Thus, the FP interferometer can be scanned rapidly (~ 5 seconds per channel, ~ 4 minutes per cycle) and the images are co-added off-line to produce the final data cube.
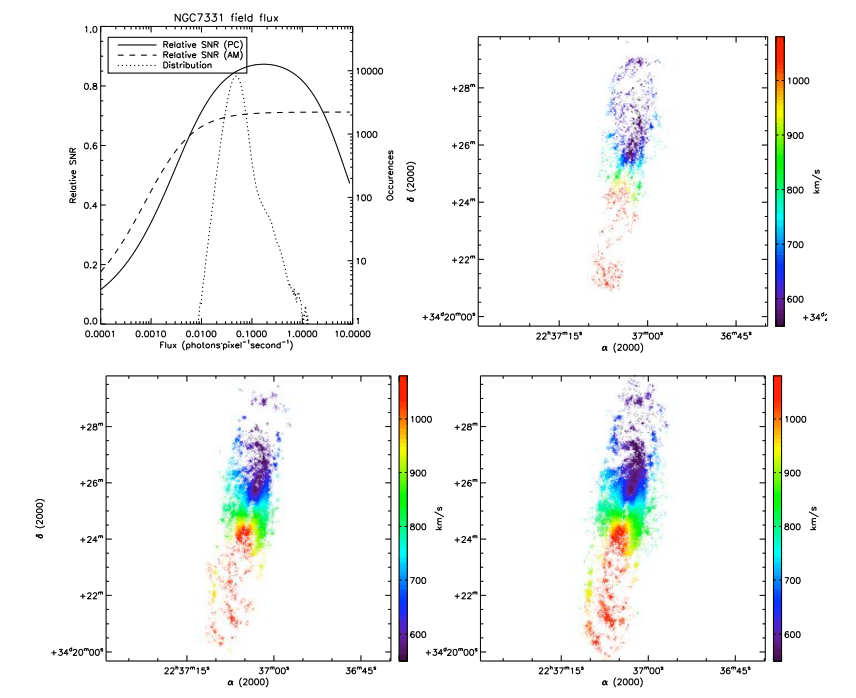
The galaxy NGC 7331 was first observed with FaNTOmM in Hα light in 2002.14 During a run with CCCP/CCD97 at the OMM, this galaxy was re-observed. For this observation, the camera was operated at 2 frames per second, and 10 images per FP channel were taken successively before moving to the next channel. A total of 38 cycles of 48 channels were observed, totalling ~150 minutes of observation, which equated the total integration time of the IPCS observation. Though the observing conditions were not perfectly equivalent for the IPCS and the CCCP/CCD97 observation, one could argue that the CCCP/CCD97 observation was made in slightly worse conditions than the IPCS one (read [5] for more details about this). The CCCP/CCD97 data was processed using a PC algorithm, where only one photon per pixel per image could be counted. The comparative results are presented in figure 7.
The gain in sensitivity achieved with CCCP/CCD97 as compared to the IPCS is obvious. Pixel for pixel, it was measured that the same SNR was achieved 5 times faster with CCCP/CCD97 than with the IPCS. Thus, for the same integration time, the CCCP/CCD97 data reveals a wider and more precise radial velocity field.
The same night the CCCP/CCD97 PC observation was made, another observation of NGC 7331 was attempted. This time, a single exposure of 5 s per channel was made for the same total integration time. The data were then processed with an AM algorithm. The PC and AM Radial Velocity maps show, as expected (from the curves of the top left panel), that the PC observation yields better results than the AM observation, even if the PC operation involved taking more images of shorter exposure time. As shown by figures 2 and 6, this gain in efficiency could not have been obtained with a camera having a higher level of CIC and a lower EM gain.
3.3 High speed photometry results
Engineering time was granted at the 1.6-m telescope of the OMM to test the CCCP/CCD97 camera for white dwarf photometry. The camera was installed at the OMM f/8 focus on a nearly full moon night. The plate scale of this set-up is 0.2500 per pixel. The star G226-29 is the brightest ZZ Ceti known and it is pulsates quickly and faintly (one of the lowest amplitude known), with a period of ~109 s and an amplitude of ~1% over the full visible spectrum.15 For this observation, a wide band, V filter was used.
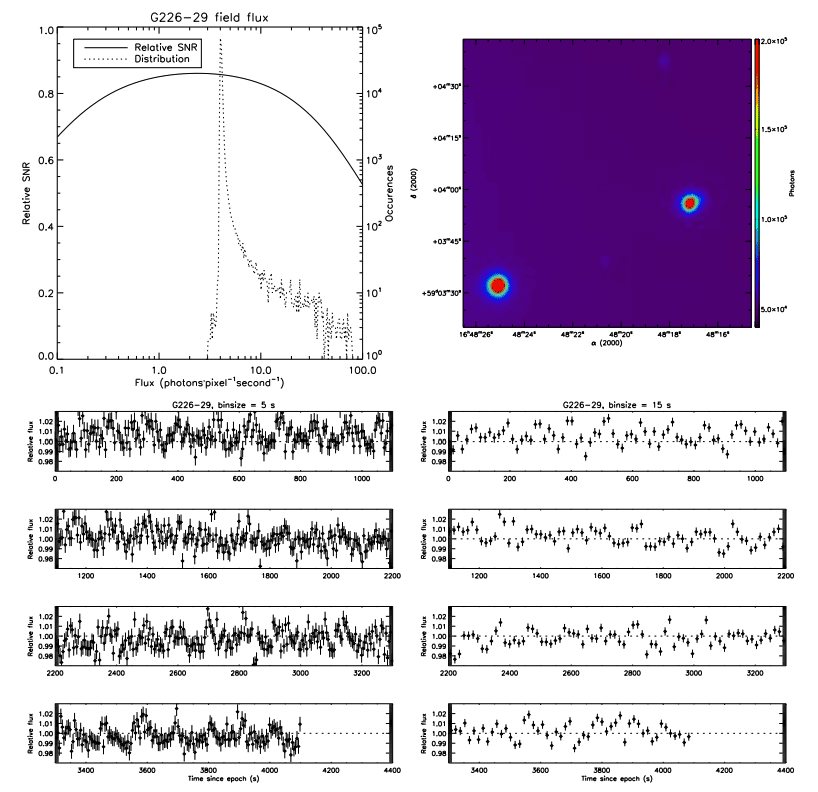
The camera was operated at 30 frames per second (0.033 s per image) as an attempt to have a mean signal well below 1 photon/pixel/image, and allow the photon counting operation to be efficient. The histogram of the observation, together with the relative SNR of the camera, are plotted in figure 8. This figure shows that the very bright sky is acquired at nearly the peak efficiency of the camera. A faster frame rate would have helped to get a better SNR on the brightest pixels.
One limitation of this observation is the lack of reference star. The small field of view of the 512 x 512 device at f/8 prevented the observation of more than one reference star. Thus, there is only one star that is bright enough to be used as a reference, and it is a double star, which may cause problems with aperture photometry in case of variable seeing. More reference stars would have allowed a better monitoring of the sky conditions. Nevertheless, a light curve was extracted, and it is shown in figure 8. This figure shows a light point every 5 and 15 seconds, which is the result of the binning of 150 and 450 frames. The mean pixel flux attributable to the sky was about 0.45 photon/pixel, and the total flux received by G226-29 is about 1300 photons/image (over its full radius of about 18 pixels). This yield a SNR of about 700 per 15 s bin. The reference star is about half of the brightness of G226-29 and its SNR per 15 s period is ~530. These SNRs are high enough to monitor the 1% variation of the luminosity of G226-29. One great advantage of the high speed data is that the final bin size can be changed with respect to the required temporal resolution or photometric accuracy, as the data is stored in 1/30 s bins.
The V filter is not perfectly suited for white dwarf photometry. Usually, a wider filter is used to gather both the B and V flux of the white dwarf, while preventing the bright sky at longer wavelength from reaching the detector. Since white dwarves are very bright in the B band, the increase in flux is considerable. Even though this first attempt at monitoring a ZZ Ceti was not made in perfect conditions, it shows that an EMCCD, which yield a high quantum efficiency and photon counting capabilities, can be used for this task. White dwarves of lower brightnesses, who have longer periods and higher amplitudes could be observed when the sky is darker, even on the small 1.6-m telescope of the OMM.
Tests made with CCCP on a CCD97 EMCCD shows that the CIC can be greatly reduced without having to resort to Non Inverted Mode Operation. The low level of CIC (0.001 – 0.002 ¯e/pixel/frame), depending on the gain, allows one to use an EMCCD in PC mode. Moreover, the CTE is better handled with CCCP, which further improves the image quality.
Analogic (amplified, no threshold) and conventional (no amplification) operation of the EMCCD with CCCP is also possible: the controller has the possibility to read the two outputs of the EMCCD. Results presented in this paper involved data taken with the CCD97, but the controller is able to drive other EMCCDs as well as conventional CCDs. CCCP is designed to operate the vertical and horizontal clocks at the maximum speed specified by manufacturers, allowing fast read-out. Lower speed operation is also possible, down to a few kHz of pixel rate. A new video board, optimized for low speed (<1 MHz), low noise acquisition is under development to further improve the operation of the conventional output of the EMCCD or to drive a low noise conventional CCD.
The observational results presented in this paper shows that the EMCCD is well suited for very low flux applications (integral field spectroscopy at high resolution), as well as for fast, broad band photometry. Other than its extremely low read-out noise, the EMCCD has many advantages over CCDs in these kind of applications, such as easier cosmic ray or satellite trace removal (lots of frames to compare and easy replacement of the pixels affected), more robustness against changing photometric conditions (offline processing can easily identify images affected by clouds and remove them), nearzero overhead induced by the read-out (the EMCCD is of frame transfer type), highly adaptive processing (the data can be binned as a function of the required SNR/temporal resolution), etc. For spectrometric applications, the spectral resolution of the observation has little impact on the SNR of the spectra, as the pixels are nearly noise free. The final resolution of a spectra can be chosen as a function of the flux, and the spectral resolution can be adaptive as a function of the strength of the emission lines. The EMCCD is well placed to replace existing imagers in instruments, which can provide a quick upgrade to get photon counting and high temporal resolution capabilities. For high flux applications, the EMCCD can be used as a conventional CCD, with a ENF of 1 and a low (3–6 ¯e) read-out noise. Thus, when one chooses to use an EMCCD in an instrument, it does not restrict its use to faint flux operation. Instead, it broadens the range of efficiency of its instrument.
The CCCP controller is available from Nüvü Camēras (www.nuvucameras.com). The company is also building whole EMCCD cameras with this controller
[1] P. Jerram, P. J. Pool, R. Bell, D. J. Burt, S. Bowring, S. Spencer, M. Hazelwood, I. Moody, N. Catlett, and P. S. Heyes, “The LLCCD: low-light imaging without the need for an intensifier,” in Society of Photo-Optical Instrumentation Engineers (SPIE) Conference Series, M. M. Blouke, J. Canosa, & N. Sampat, ed., Society of Photo-Optical Instrumentation Engineers (SPIE) Conference Series 4306, pp. 178–186, May 2001.
[2] M. Robbins and B. Hadwen, “The noise performance of electron multiplying charge-coupled devices,” Electron Devices, IEEE Transactions on 50, pp. 1227–1232, May 2003.
[3] O. Daigle, C. Carignan, and S. Blais-Ouellette, “Faint flux performance of an EMCCD,” in Society of Photo-Optical Instrumentation Engineers (SPIE) Conference Series, Presented at the Society of Photo-Optical Instrumentation Engineers (SPIE) Conference 6276, July 2006.
[4] A. G. Basden, C. A. Haniff, and C. D. Mackay, “Photon counting strategies with low-light-level CCDs,” MNRAS 345, pp. 985–991, Nov. 2003.
[5] O. Daigle, C. Carignan, J. Gach, C. Guillaume, S. Lessard, C. Fortin, and S. Blais-Ouellette, “Extreme Faint Flux Imaging with an EMCCD,” PASP 121, pp. 866–884, Aug. 2009.
[6] “Low-light technical note 4 dark signal and clock-induced charge in l3vision ccd sensors,” tech. rep., E2V Technologies, http://www.e2vtechnologies.com/secure/datasheets/l3vision_ccds/ low_light_tn4.pdf, June 2004.
[7] O. Daigle, J.-L. Gach, C. Guillaume, C. Carignan, P. Balard, and O. Boisin, “L3CCD results in pure photoncounting mode,” in Optical and Infrared Detectors for Astronomy., J. D. Garnett and J. W. Beletic, eds., pp. 219–227, Sept. 2004.
[8] S. Tulloch, “Monte Carlo Modeling of L3 Detectors in High Time Resolution Applications,” in High Time Resolution Astrophysics: The Universe at Sub-Second Timescales, American Institute of Physics Conference Series 984, pp. 148– 161, Feb. 2008.
[9] D. Ives, N. Bezawada, V. Dhillon, and T. Marsh, “ULTRASPEC: an electron multiplication CCD camera for very low light level high speed astronomical spectrometry,” in Society of Photo-Optical Instrumentation Engineers (SPIE) Conference Series, Society of Photo-Optical Instrumentation Engineers (SPIE) Conference Series 7021, Aug. 2008.
[10] N. Law, Lucky Imaging: Diffraction-limited astronomy from the ground in the visible. PhD thesis, Ph.D dissertation, 2006. 179 pages; Cambridge University, 2006.
[11] L. Zhang, L. Neves, J. S. Lundeen, and I. A. Walmsley, “A characterization of the single-photon sensitivity of an electron multiplying charge-coupled device,” Journal of Physics B Atomic Molecular Physics 42, pp. 114011–+, June 2009.
[12] J.-L. Gach, O. Hernandez, J. Boulesteix, P. Amram, O. Boissin, C. Carignan, O. Garrido, M. Marcelin, G. Ostlin, ¨ H. Plana, and R. Rampazzo, “Fabry-Perot Observations Using a New GaAs Photon-counting System,” ´ PASP 114, pp. 1043–1050, Sept. 2002.
[13] O. Hernandez, J.-L. Gach, C. Carignan, and J. Boulesteix, “FaNTOmM: Fabry Perot of New Technology for the Observatoire du mont Megantic,” in Society of Photo-Optical Instrumentation Engineers (SPIE) Conference Series, M. Iye and A. F. M. Moorwood, eds., Presented at the Society of Photo-Optical Instrumentation Engineers (SPIE) Conference 4841, pp. 1472–1479, Mar. 2003.
[14] O. Daigle, C. Carignan, P. Amram, O. Hernandez, L. Chemin, C. Balkowski, and R. Kennicutt, “H↵ kinematics of the SINGS nearby galaxies survey - I,” MNRAS 367, pp. 469–512, Apr. 2006.
[15] S. O. Kepler, E. L. Robinson, and R. E. Nather, “The light curve of the ZZ Ceti star G226-29,” ApJ 271, pp. 744–753, Aug. 1983.