EMCCDs are capable of extreme low light imaging thanks to sub-electron read-out noise, enabling single-photon counting. The characterization of e2v’s CCD60 (128 x 128), CCD97 (512 x 512) and CCD201-20 (1024 x 1024) using a controller optimized for the driving of EMCCDs at a high (≥ 10 MHz) pixel rate per output with < 0.002 e total background signal. Using the CCD Controller for Counting Photons (CCCP), the horizontal and vertical CIC, dark current and EM gain stability are characterized.
The CCD Controller for Counting Photons1 (CCCP), an electronic controller built with the aim of driving Electron Multiplying Charge Coupled Devices (EMCCDs) at a high (≥ 10 MHz) speed, with low (<< 1 e) effective read-out noise, and the lowest possible Clock Induced Charges (CIC), was used to drive e2v’s CCD60 (128 × 128 FT), CCD97 (512 × 512 FT) CCD201-20 (1024 × 1024 FT) and CCD207-40 (1600 × 1600 FF). Cameras built with the CCCP and the CCD60, CCD97 or the CCD201-20, respectively named EMN2 128, EMN2 512 and EMN2 1024, are now commercially available from Nüvü Camēras. In this paper, the characterization results of theses cameras is presented. For data regarding the CCD207-40, the reader is referred to [2].
First results were presented in [3] regarding the performance of an EMN2 512 camera. It was demonstrated that it was possible to drive the EMCCD in Inverted Mode Operation (IMO) and, at -85◦C, to get an effective read-out noise of 0.02 e (G/σ ratio of 50) while generating 0.0025 e/pixel/image of CIC (measured with a 5σ threshold) and generate less than 0.001 e/pixel/s of dark current. This extreme low noise enabled the use of this EMCCD in Photon Counting (PC) and, for low light applications (< 10 photons/pixel/s), reducing by 33% the time required to reach a given SNR when compared to the analog Mode (AM, sometimes called Linear Mode), despite a frame-rate 10× larger.
In this paper, the horizontal charge transfer efficiency measurements are presented in section 2. Measurements of the CIC generated by the vertical and horizontal transfers are presented in section 3. The dark current, as a function of temperature, was measured and the data are presented in section 4. The stability of the EM gain is presented in section 5.
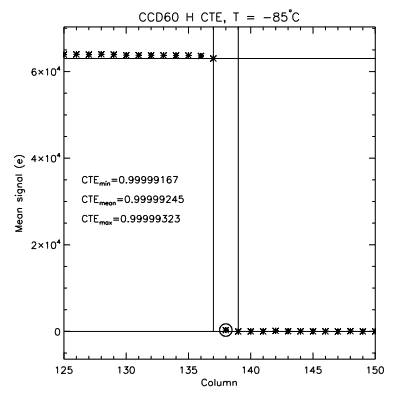
The horizontal charge transfer efficiency of the EMCCDs was measured on the CCD60 by using a relative technique, the extended pixel edge response4 (EPER). Flat-fields were taken with moderate (>10 ke/pixel) illumination and the deferred charges were measured in an overscan region. In order to increase the SNR, lines were averaged on half of the EMCCD and 10 images were taken with the same integration time under a stabilized light source. The CTE was measured by using three columns, taking the last one as the zero reference (Zm), the second one as the deferred measurement (Dm) and the first one as the signal level (Sm). Then, the CTE was calculated by using :

where Nt is the number of horizontal transfers required to take these pixels out of the device. The noise of the measurement was estimated by the standard deviation of the columns after the columns used for the deferred charge measurement. The results are shown in Figure 1.
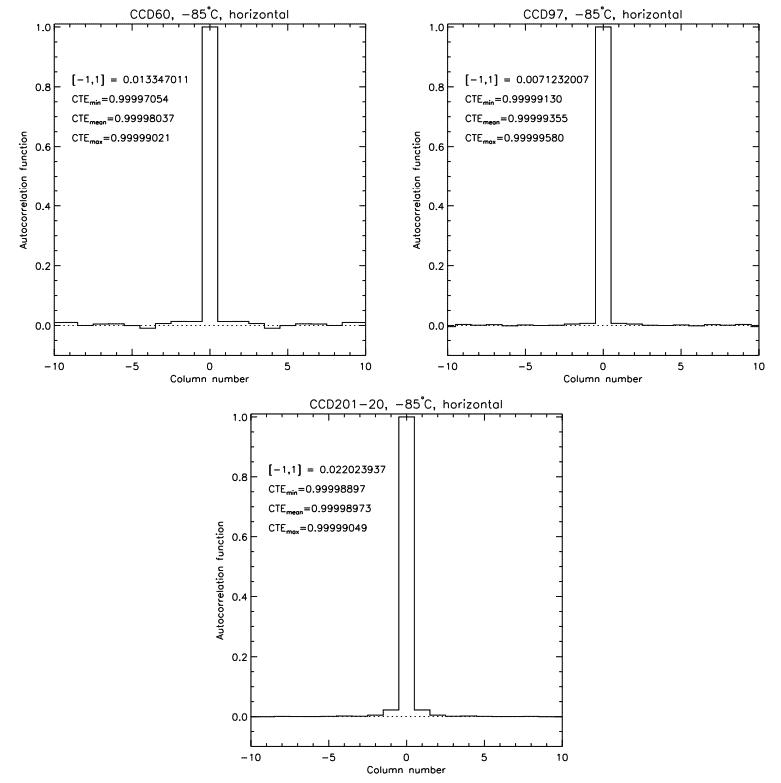
The EPER technique was not used for the CCD97 and CCD201-20 since these CCDs exhibit a masked region around the active area where charge might diffuse under the mask and masquerade as deferred charge (e2v, private communication). Instead, the CTE was measured with the horizontal auto-correlation of faintly lit (∼ 0.01 e/pixel/image) flat taken at a high gain, as used in [5]. The measurements were taken at an EM gain of 50σ and the results are shown in Figure 2. The CTE is measured as follows :
![]()
where a is the auto-correlation function of the pixels at offsets −1 and 1 from the central pixel. a is already normalized since the auto-correlation at offset 0 is 1. The noise of the measurement was estimated by the standard deviation of the auto-correlation function for offsets 2 and higher from the central pixel. The figures shows the CTE derived from the auto-correlation function measured at indices [−1, 1] plus or minus the standard deviation. The CTE measurements for the EPER and the auto-correlation methods are summarized in Table 1.
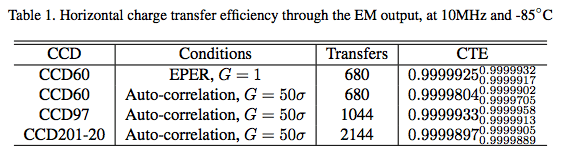
The CTE is a measurement of the charge being transferred from one element of the horizontal register to the other. This means that in the case of the EMCCD, the EPER and the auto-correlation methods employed in this manner do not differentiate the CTE of the conventional horizontal register from the CTE of the EM horizontal register.
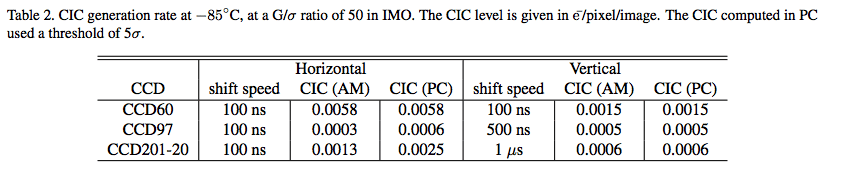
As demonstrated in [3], by using the CCCP to clock a CCD97 in IMO, the CIC generated by the vertical shift of the charges can be brought down to a very low level, 0.0005 e¯/pixel/image. The vertical and horizontal CIC were measured for the CCD60, CCD97, and CCD201-20. In order to disentangle the horizontal from the vertical CIC components, the CCDs were overscanned in both the horizontal and vertical directions. For each CCD, 1000 dark images of zero integration time were taken at a high EM gain (G/σ ratio of 50). The images were processed in AM.
The resulting images are constituted of 4 quadrants. The top left quadrant is the image area. It contains the total unwanted signal, which is the dark current accumulated in the image area during the integration, the dark current accumulated in the storage area during the read-out, the CIC generated during the image vertical shift, the CIC generated during the storage vertical shift, and the CIC generated by the horizontal shift. The bottom left quadrant is the vertical overscan. It contains the dark current generated in the storage area during the read-out, the CIC generated during the storage vertical shift, and the CIC generated by the horizontal shift. The right quadrants correspond to the horizontal overscan. They contain the CIC generated by the horizontal shift. Thus, the horizontal CIC can be obtained readily from the right quadrants. The vertical CIC can be obtained by subtracting the horizontal CIC and the dark signal from the top left quadrant. The measurement of the dark signal is covered in section 4. The horizontal CIC computed in AM and PC differs, as the CIC generated in the EM register exits with an amplification that is a function of the element at which it was generated. Thus, when transposed to the image domain, the mean intensity of the horizontal CIC computed in AM is less than one electron per electron.
The results are given in Table 2. Since the CIC is a function of the shift speed, the shift speed at which the measurements were made are given in this table. For all three CCDs, at a high EM gain, it is the CIC generated during the horizontal shift that dominates. The use of a lower EM gain yields a lower horizontal CIC, but it hardly comes below the level of the vertical CIC. For example, at G/σ ratio of 5, the horizontal CIC (computed in AM) of the CCD201-20 is 0.0007 e/pixel/image.
According to [6], the dark current at a temperature of -40◦C in IMO is about 200 times lower than when the CCD is operated in NIMO, as the surface of the CCD is populated with holes and the thermally generated electrons can recombine before they reach the pixel well. Moreover, it is the movement of the holes at the surface of the CCD that generates the CIC during the vertical transfer.4 Thus, as proposed in [6], the NIMO operation of an EMCCD can generate about 30 times less CIC than in IMO. The best operating conditions of an EMCCD (IMO – NIMO) would thus depend on integration time, short integration times benefiting from the lower CIC of the NIMO, and long integrations benefiting from the lower dark current of the IMO.
Moreover, the surface dark current is also known to have a characteristic time constant that varies with temperature.7 Authors have reported8 that switching the clocks between inversion and out-of-inversion states during the exposure of the CCD can allow the CCD to operate below the characteristic time constant of the surface current generation, hence allowing this dark signal component to be greatly reduced, even in non-inverted mode. For short integration times, the read-out of the CCD has the same dither effect, as the parallel clocks are switched during this process.
Section 3 showed that by using the CCCP, the CIC was dominated by its horizontal component. Thus, the NIMO operation of the CCD would yield little advantage over the IMO. It was deemed relevant to measure the total background signal of the EMCCDs as a function of the integration time, temperature, and operating mode.
In IMO, the total background signal as a function of the integration time is roughly linear. From the CIC floor at t = 0, it scales linearly with the integration time. The dark current was measured by running the devices at a high EM gain (G/σ of 50), taking multiple images ranging from 0 to 32 s of integration, processing the frames in PC (5σ threshold) and fitting a first degree equation to the mean signal as a function of the integration time. The process was repeated for the CCD60, CCD97 and CCD201-20 at temperatures between −65◦C and −105◦C. The results are shown in Figure 3. The data is corrected for the signal lost by the 5σ threshold (9.4% loss).
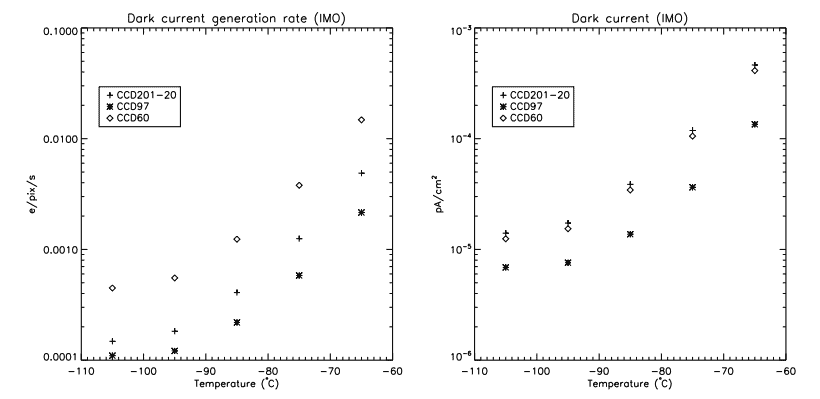
The left panel of Figure 3 shows the dark current in pA/cm2 , which accounts for the pixel pitch of the devices (13µm for the CCD201-20, 16 µm for the CCD97, and 24µm for the CCD60). Although the dark current of the CCD97 is significantly lower than the one of the CCD201-20 and CCD60, such a difference could be accounted for by differences in epitaxial silicon wafers from which the devices are made (e2v, private communication).
The same CCD201-20 that was used for the IMO measurements was also clocked in NIMO, and its dark current and total background signal was measured. As stated earlier, the dark current in NIMO and at cryogenic temperatures does not behave linearly. When the time between read-outs is lower than the characteristic time required by the surface current to settle, a part of it is inhibited. This behaviour is seen in Figure 4, where the dark current is lower for frames of 1 s of integration than for those of higher integration time (+ signs). On the other hand, the dark current of the IMO operation is rather linear, the variation for integration times smaller than 1 second being explained by the challenge of measuring such a faint signal (less than 0.0001 e/pixel/image). This plot was generated by subtracting the mean background signal in a 0-s image from the mean signal measured for longer integration times. The resulting value was divided by the integration time.
The total background signal is the ultimate parameter that must be accounted for extreme faint flux imaging. It is the sum of the CIC and the dark current. Thus, the plot of the total background signal per pixel per image as a function of the integration time will yield the best operating parameters for a given integration time. The left panel of Figure 5 shows the mean background signal measured in IMO on the CCDs as a function of the integration time. It shows the CIC-dominated plateau at short integration times, and the dominance of the dark current for longer integration times. At −85◦C, the dark current dominates the CIC for integrations longer than ∼5 s.
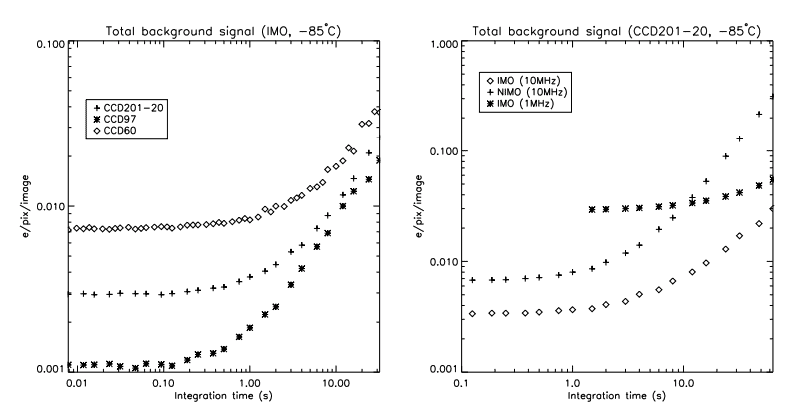
The idea of driving the CCDs in NIMO to circumvent the vertical CIC at the price of a higher dark current6 was tested with the CCD201-20. The solid and dotted lines in the right panel of Figure 5 shows the measurement of the total background signal as a function of the integration time for the IMO and NIMO operations at 10 MHz. For these measurements, the high and low levels of the vertical clocks were modified to make the CCD operate in either IMO or NIMO, while the same pattern was used for the horizontal clocks. It showed that, when using the CCCP, regardless of the integration time, the total background signal of the NIMO operation is always higher than that of the IMO operation.
The CCD201-20 was also clocked horizontally at 1 MHz in IMO (dashed line in Figure 5). While the dark current is the same as when it is clocked at 10 MHz, the amount of CIC generated in the horizontal register is dramatically higher (∼0.03 e/pixel/image), even though the EM gain required to get a G/σ ratio of 50 is lower since the real read-out noise is lower. Thus, when it comes to extreme low flux, it is best to operate the EMCCDs at high speed to lower the impact of the horizontal CIC.
The EM gain stability was measured by faintly illuminating (∼0.05 photon/pixel/image) the device with a stabilized light source and reading it out constantly during an extended period of time. The mean EM gain of the images was then measured by fitting the output probability equation of the EM register9 to the histogram of all of the images. Then, the gain variation from image to image was computed by taking the mean value of every image. Since the illumination is stable, variation in the measured light intensity would indicate a variation of the EM gain. The results are shown in Figure 6.
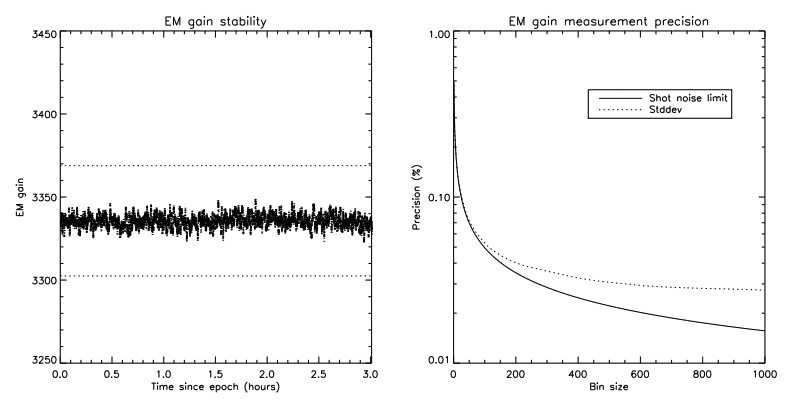
The employed technique limits the precision measurement of the EM gain to the shot noise. Since the mean signal per image is about 50 000 photons, the EM gain per image can be measured down to 1/ √(50000) ≈ 0.4% per image. In order to reach a higher precision, images have to be averaged. The data in the left panel of Figure 6 was obtained by averaging 20 images together, which gives a temporal resolution of ∼1.6 s and a shot noise limit of 0.1%. The standard deviation of the measurement is 0.1%, which means that it is still dominated by shot noise and that low-frequency components (coloured noise) are below that level. The right panel of Figure 6 shows the standard deviation of the measurement as a function of the bin size. It shows that the standard variation of the measurement deviates from the shot noise for a measurement precision <0.05%. This would mean that the EM gain stability of the camera is limited to about 0.05%.
This paper described the characterization process and results of three EMCCDs from e2v Technologies driven with the CCD Controller for Counting Photons from Nüvü Camēras: the CCD60 (128 × 128, 24 µm), CCD97 (512 × 512, 16 µm), and CCD201-20 (1024 × 1024, 13 µm). Thanks to both the CCCP and the IMO operation of the CCDs, a high pixel rate (10 MHz) can be obtained at the same time as a very low total background signal (dark current and CIC, section 4.3) while maintaining a high CTE (section 2). The stability of the EM gain was measured to be better than 0.05% over hours of operation (section 5).
The three EMCCDs are integrated into the EMN2 cameras from Nüvü Camēras, which are liquid nitrogen cooled. These CCDs are also being integrated into the thermoelectric-cooled HNü (hν) cameras. These cameras will sport both air and water cooling, each allowing operating temperatures below −85◦C, a smaller form factor, a higher maximum pixel rate, while maintaining the same low background signal level and image quality. The HNü cameras will be available by the end of 2012.
The development by e2v of a new EMCCD device, a 4k × 4k, 12µm pixel pitch, frame transfer, is being funded by the Universite de Montréal. It will support frame rates of up to 4 frames per second through 8 EM outputs. Nüvü Camēras has already started designing the electronics to drive this novel detector and will support it in its line of cameras.
[1] Daigle, O., Gach, J.-L., Guillaume, C., Lessard, S., Carignan, C., and Blais-Ouellette, S., “CCCP: a CCD controller for counting photons,” in [Society of Photo-Optical Instrumentation Engineers (SPIE) Conference Series], Society of Photo-Optical Instrumentation Engineers (SPIE) Conference Series 7014 (Aug. 2008).
[2] Andrade, D., Daigle, O., Guzman, D., Taylor, K., de Oliveira, C., and Ramirez-Fernandez, J., “EMCCD camera noise performance for the Brazilian tunable filter imager,” in [Society of Photo-Optical Instrumentation Engineers (SPIE) Conference Series], Society of Photo-Optical Instrumentation Engineers (SPIE) Conference Series 8453 (July 2012).
[3] Daigle, O., Quirion, P.-O., and Lessard, S., “The darkest EMCCD ever,” in [Society of Photo-Optical Instrumentation Engineers (SPIE) Conference Series], Society of Photo-Optical Instrumentation Engineers (SPIE) Conference Series 7742 (July 2010).
[4] Janesick, J. R., [Scientific charge-coupled devices], Scientific charge-coupled devices, Bellingham, WA: SPIE Optical Engineering Press, 2001, xvi, 906 p. SPIE Press monograph, PM 83. ISBN 0819436984 (2001).
[5] Tulloch, S. M. and Dhillon, V. S., “On the use of electron-multiplying CCDs for astronomical spectroscopy,” MNRAS 411, 211–225 (Feb. 2011).
[6] “Low-light technical note 4 dark signal and clock-induced charge in l3vision ccd sensors,” tech. rep., E2V Technologies, http://www.e2v.com/e2v/assets/File/documents/ imaging-space-and-scientific-sensors/Papers/low_light_tn4.pdf (June 2004).
[7] Burke, B. and Gajar, S., “Dynamic suppression of interface-state dark current in buried-channel ccds,” Electron Devices, IEEE Transactions on 38, 285 –290 (feb 1991).
[8] Jorden, P., Pool, P., and Tulloch, S., “Secrets of e2v technologies ccds (ex marconi ccds),” Experimental Astronomy 14, 69–75 (2002).
[9] Basden, A. G., Haniff, C. A., and Mackay, C. D., “Photon counting strategies with low-light-level CCDs,” MNRAS 345, 985–991 (Nov. 2003).